Methodology & ATBD

The sections below describe the characteristics, networks, and a brief summary of the methodology applied by MapBiomas Indonesia to produce a time-series of land-use and land-cover data showing annual transitions over the collection period. 

The applied methodology is presented in the Algorithm Theoretical Basis Documents (ATBD) 

Land-use and land-cover maps of MapBiomas Indonesia were produced by applying a pixel-based approach on Landsat images. Machine-learning algorithms were developed to analyze the images using the tremendous cloud processing capacity provided by the Google Earth Engine.


Collection of Landsat Images Pixel by Pixel Processing Cloud Processing
(Resolusi 30-meter resolution) (30 x 30 Meters)  


Following a series of discussions with technical experts from within Indonesia and from MapBiomas Brazil, the Mapiomas Indonesia team decided to classify 11 types of land-use and land-cover to be mapped, consisting 5 classes for basic themes and 6 classes for cross-cut themes.


The Indonesia team was divided into the core team and the regional team. The analysis for the basic themes was under the regional team’s responsibility being done by 9 of the civil society organizations. Meanwhile, the cross-cut themes were handled by the Auriga Nusantara and Woods & Wayside International.


MapBiomas Mosaics are created from a collection of all available Landsat scenes within a particular unit of a grid during a certain period. From these, the best images for each pixel were selected to be combined into a Landsat grid. Each unit, or module, of the grid covered an area of 1o latitude x 1.5o  longitude with a total of 286 modules to cover all of Indonesia. A grid-based approach was run for every year during 2000-2022 to create the mosaics. The process used to create the MapBiomas Mosaics is briefly illustrated below:


To classify land-cover categories, a supervised classification process was conducted using a guided sampling process. Spectral parameters were inputted to the Random Forest algorithm, which then was used to analyze the characteristics of the samples. Once the Random Forest algorithm had been trained with the combination of spectral parameters and samples, the algorithm classified all pixels for the entire area of Indonesia. The classification process is illustrated below:


MapBiomas Indonesia applied a post-classification process to stabilize the data and to reduce bias once the classification process was completed. The post-classification processes included  the use of: a spatial filter; a temporal filter; a gap-fill filter; a frequency filter; and an incident filter.


Spatial Filter

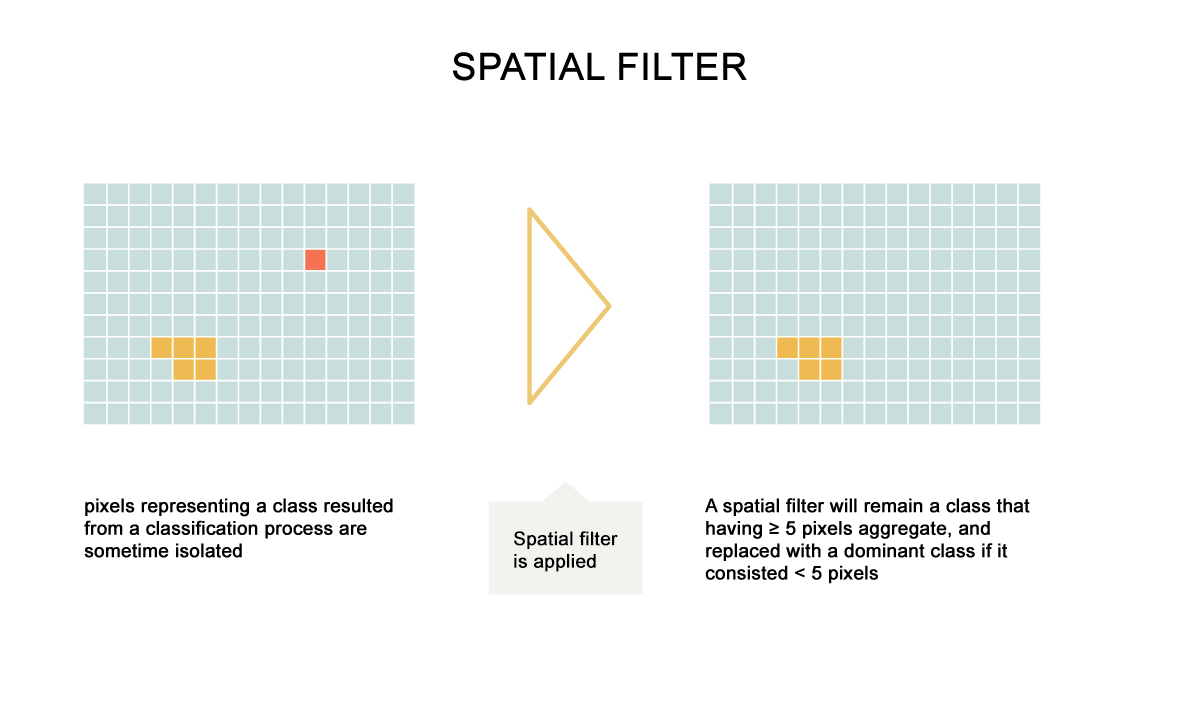
The spatial filter was used to prevent changes in classification values in groups of pixels. The filter is made based on “connectPixelCount” where the function would position connected pixel components with the same pixel values. This filter requires at least five connected pixels as a minimum connection value.


Temporal filter

The temporal filter was used to identify unwanted transitions occurring over three to five years. The filter would examine and change the central position of non-sequential pixels for reclassification according to prior and subsequent classes.


Gap-Fill Filter

In producing Landsat mosaics, areas containing clouds or shadows were often recorded as ‘no-data’ during the classification process. A gap-fill filter was applied to fill areas recorded as ‘no-data’ with data based on the previous year’s land-cover for the same pixel.

Frequency filter

The frequency filter considered the occurrence of a particular class across the time series. All class occurrences with a persistence of less than 10% were filtered and classified as non-class.

Incident filter

The incident filter was used to stabilize pixel values that changed too frequently over the 20 years. This usually occurred at boundaries between classes. Pixel values that had changed more than eight times were replaced by stable pixel values in the time series.

Regional classification products that had undergone filtering processes for each year from 2000-2022 were then integrated with cross-sectoral themes by applying a set of specific hierarchical prevalence rules.


Transitions show the dynamics of land-use and land-cover change for a particular geographic area over a defined period of time. MapBiomas Indonesia analyzed the transitions based on time periods as: (a) per year, (b) per 5 years, (c) per 10 years, (d) all observed years.


The statistics of the defined classes were calculated based on several spatial units, such as administrative boundaries, Indonesia’s legally-defined Forest Estate, watersheds, forest and peatland moratorium areas, and concession areas that were included in zonal statistics.

Validation will be conducted through an accuracy analysis based on statistical techniques using independent sample points with visual interpretation for the whole of Indonesia and for all observed years. The validation process has not yet been conducted for MapBiomas Indonesia’s Collection 1.0. Samples intended for validation are being prepared and will be applied for the next collection of MapBiomas Indonesia.

An Initiative of:

Collaboration:

Supported by: